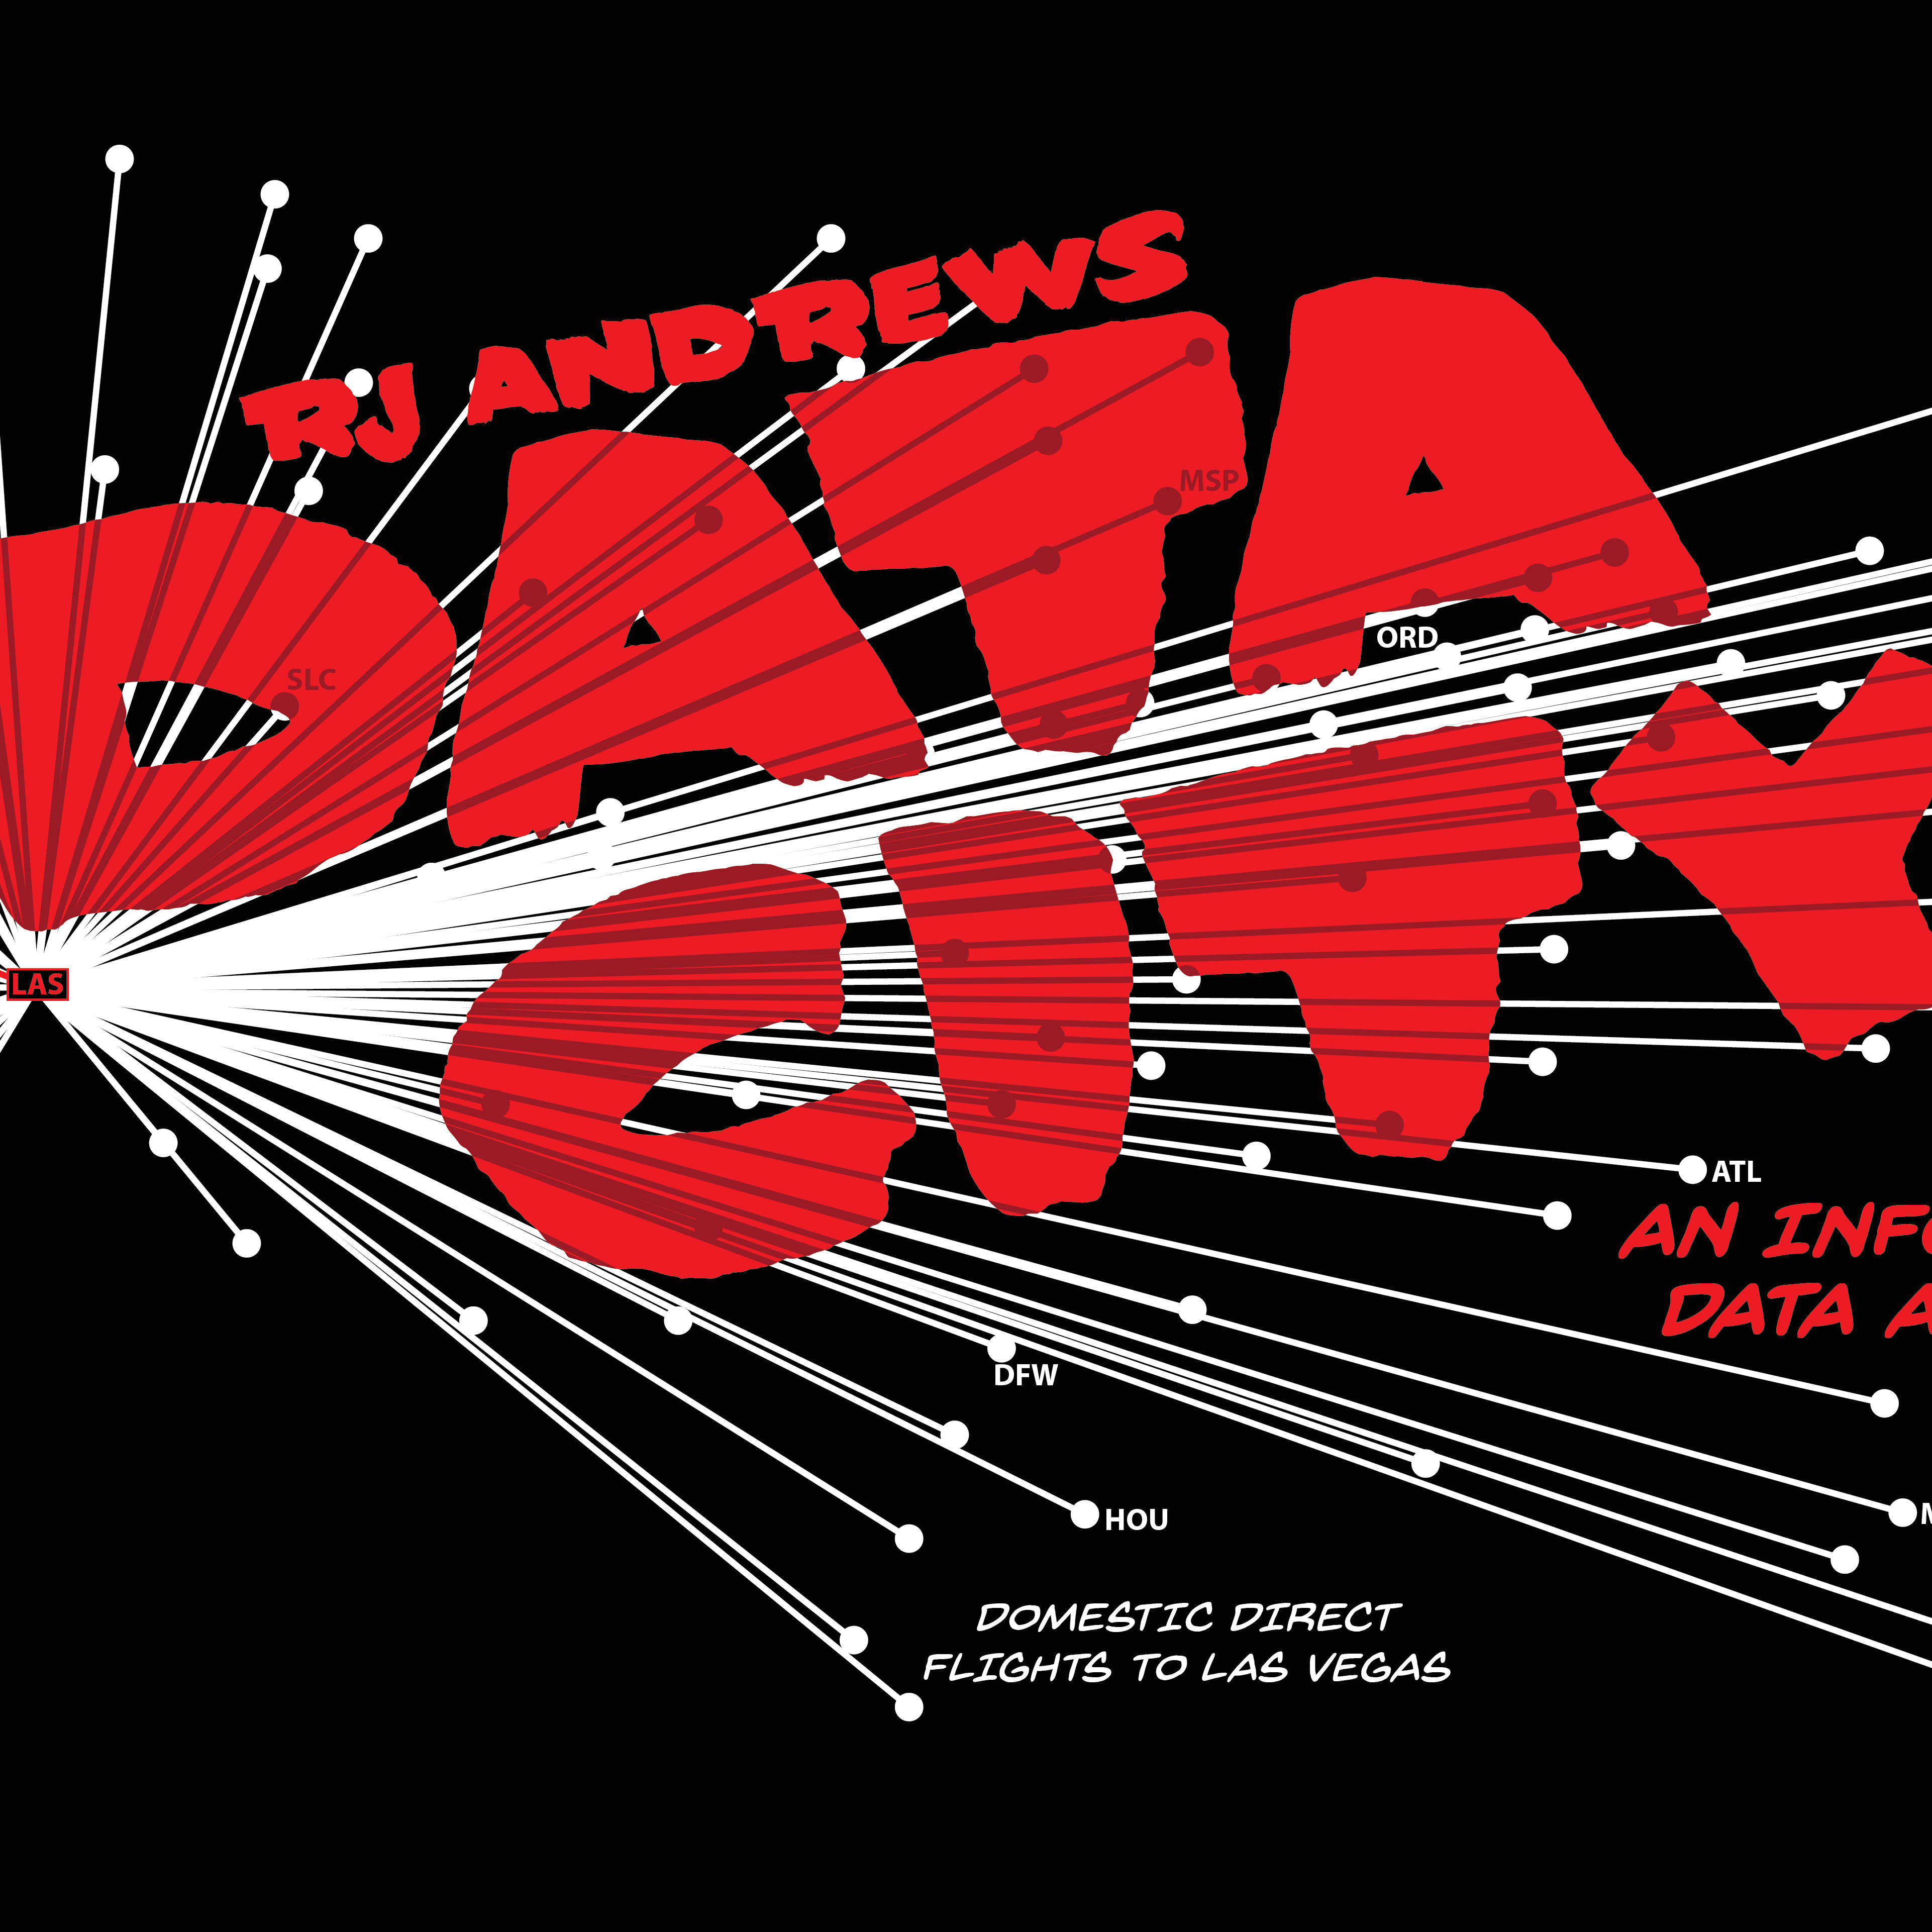
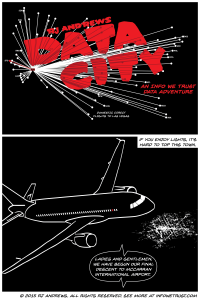
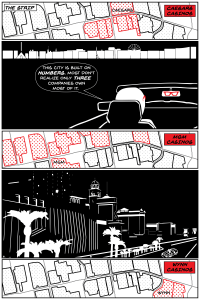
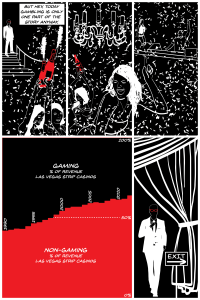
Data storytelling and the graphic novel are smashed together in one adventure through the numbers behind the city built on numbers: Las Vegas, Nevada. Explore the underside of tourism, gambling, and entertainment as we move through one exciting evening on the Strip.

Alternatively, you can click through the gallery below:

Design Process
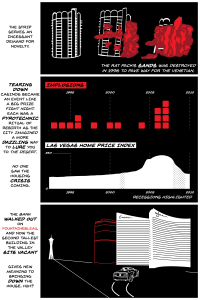
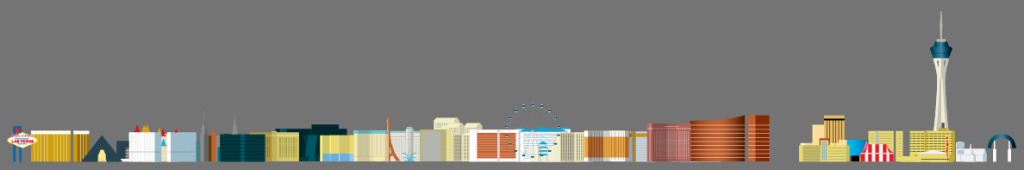
This project began as an investigation of the buildings of Las Vegas. I quickly re-discovered the beautiful Propublica interactive timeline of the buildup of the Las Vegas strip (detail below) and immediately started searching for another angle on Sin City.
I became fixated on Las Vegas' obsession with implosions in the 1990's and 2000's and made this GIF showing all major Strip implosions at once. Toying with the title Bringing Down the House I was also inspired by Keith Richards' quip, "I'm not an arsonist, I'm a pyromaniac."
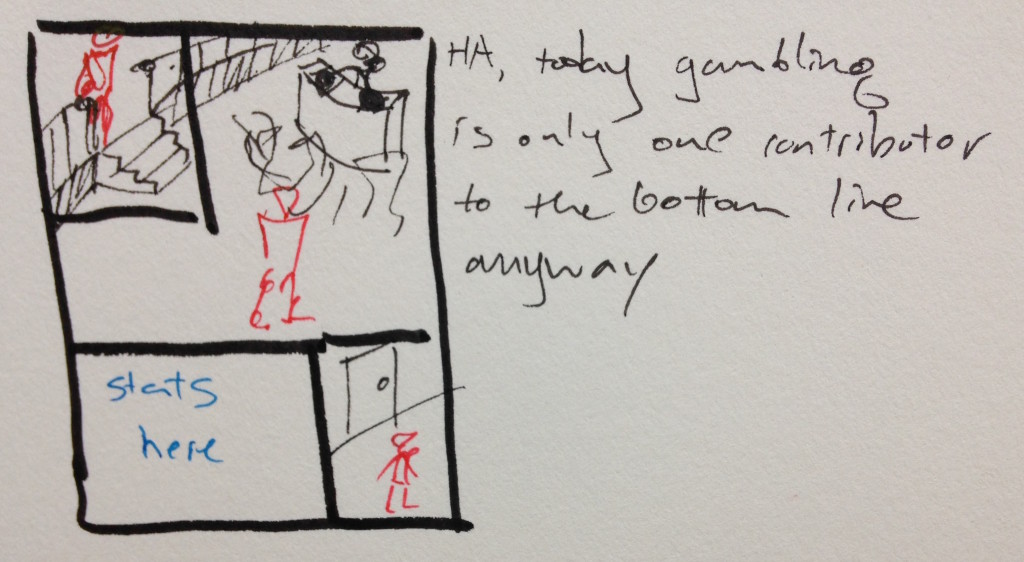
But in researching the implosions I came across so many different data story angles about Las Vegas that I wanted to tell. And so I started sketching ideas, and the scope got a lot bigger:
Of course, the tone of the entire piece is inspired by Frank Miller's Sin City. But beyond using a lot of black and white it is hard to claim any relationship to his masterpiece artwork and storytelling. If you enjoy a fun exploration of the underbelly of a failed city, I strongly recommend the entire BIG DAMN SIN CITY. If you really want to geek out, treat yourself to THE ART OF SIN CITY.
In addition, Scott McCloud's UNDERSTANDING COMICS and Nick Sousanis' UNFLATTENING have both been very instructive and inspiring, for this project and many others.
Generally, my creative process follows that described by polymath Hermann Von Helmholtz with a slight addition:
- SATURATION: reading lots of books, talking to experts, and digging the web
- INCUBATION: giving space for ideas to brew, often with sleep
- ILLUMINATION: often while I am swimming
- (PRODUCTION): many tools are needed, often unique ones for each project, most things see Tableau and Adobe Illustrator at some point in the process
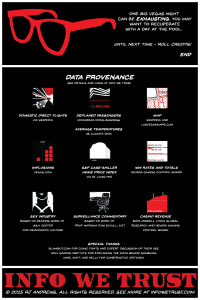
Data Provenance
The data sources get the final panel in DATA CITY. Here are some details:
- Domestic Direct Flights from Wikipedia
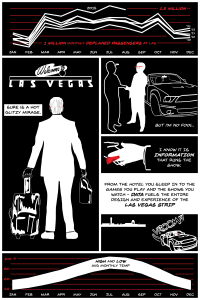
- Deplaned Passengers from McCarran Doing Business statistics page
- Average Las Vegas Temperature from USClimateData
- Implosions: from many sources, particularly Vegas.com
- Home Price Index: S&P Case Schiller via St Louis Fed
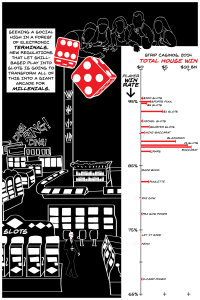
- Win Rates and Totals: Nevada Gaming Control Board via UNLV Gaming Research
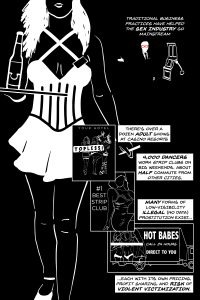
- Sex Industry commentary is based on UNLV's "Sex Industry and Sex Workers in Nevada." from its Center for Democratic Culture
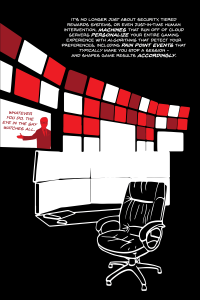
- Surveillance commentary is based on work of MIT Profesor Natasha Dow Schüll. This is a great interview.
- Casino gaming vs. non-gaming revenue is from BofA Merrill Lynch Global Research and Nevada Gaming Board, via Business Insider.
The following resources were also very helpful:
- Blambot's article on comic book grammar and tradition
- Casino math explained by UNLV
Info We Trust is a data adventure exploring how to better humanize information. To learn more read the opening post here. The creator, RJ Andrews, is an engineer and proud Northeastern University and MIT graduate. Please reach out through facebook, twitter @infowetrust, or the contact page. Prints are available here.

No comments.